In This Article
You’re standing 150 yards from the pin, debating between your 7-iron and 8-iron. Sound familiar? Here’s the uncomfortable truth most golfers won’t admit: they have no idea how far they actually hit each club. They guess, they hope, and they consistently come up short or fly the green.

A golf club distance chart isn’t just a reference guide—it’s your personal roadmap to lower scores. What most amateurs overlook is that knowing your distances transforms club selection from guesswork into science. The difference between a 15-handicapper and a 5-handicapper often isn’t swing mechanics or equipment—it’s knowing exactly which club will land the ball on the green, not 20 yards short in the bunker.
In my years of coaching golfers, I’ve noticed something fascinating: players who track their distances with precision drop an average of 3-5 strokes within their first month. Why? Because instead of hitting a “comfortable 7-iron” that comes up short, they confidently grab the 6-iron and stick it close. The modern game demands this level of precision, and technology now makes it accessible to everyone—from weekend warriors to aspiring scratch golfers. According to USGA handicap statistics, the average male golfer carries a 14-15 handicap, and distance management is one of the fastest paths to improvement.
The challenge is that generic distance charts tell you what the “average golfer” hits. But you’re not average—you have your own swing speed, strike pattern, and equipment setup. This guide will show you how to build your personal golf club distance chart, understand what factors affect your distances, and arm yourself with the right tools to dial in every club in your bag.
Quick Comparison: Best Distance Tracking Tools
| Tool Type | Best For | Price Range | Key Advantage |
|---|---|---|---|
| Distance Cards | Budget-conscious golfers | $5-$15 | Wallet-sized, instant reference |
| Laser Rangefinders | Precision players | $50-$600 | Exact yardages, slope adjustment |
| GPS Watches | Tech-savvy golfers | $150-$500 | Course maps, shot tracking |
| Launch Monitors | Serious improvers | $200-$20,000 | Complete swing data, indoor use |
| Distance Bag Tags | Convenient tracking | $10-$25 | Writable surface, clips to bag |
Looking at this comparison, the sweet spot for most golfers sits in the $50-$150 range with a basic laser rangefinder or GPS watch. What the chart doesn’t show is that distance cards paired with consistent range sessions offer the best value—you’re investing $10 and your practice time rather than relying solely on expensive technology. For players serious about improving, though, a launch monitor like the PRGR around $200 bridges the gap between guesswork and professional-level data without breaking into the four-figure range that Trackman demands.
💬 Just one click — help others make better buying decisions too! 😊
Top 5 Golf Club Distance Chart Tools: Expert Analysis
1. Golf Club Range Chart Card by Various Brands
These wallet-sized reference cards have become the secret weapon in thousands of golf bags, and for good reason—they work. The typical card measures 3.5″ x 2″ (credit card size) and displays average distances for 15 clubs across beginner, average, and good golfer categories. Made from waterproof PVC with 0.03″ thickness, these cards survive everything from morning dew to unexpected downpours.
What the spec sheet won’t tell you: the real value isn’t in the pre-printed distances—it’s in having a constant reminder to think about your numbers. I’ve watched golfers improve simply because that card in their wallet forced them to actually consider which club to use instead of defaulting to their “favorite.” The pre-printed averages give beginners a starting point, but experienced players often use the blank versions to write their actual distances.
Customer feedback consistently praises the durability and pocket convenience. One reviewer mentioned keeping theirs for three seasons without any wear, despite daily rounds in Florida humidity. The common complaint? The pre-printed numbers don’t match modern club lofts, which have gotten stronger by 2-4 degrees compared to traditional sets.
✅ Pros:
- Fits in wallet for instant access
- Waterproof and tear-resistant
- Under $10 investment
❌ Cons:
- Generic distances may not match your swing
- Small text can be hard to read in fading light
Price range: Around $6-$12 for quality options. The slightly higher-priced versions around $10-$12 typically feature clearer fonts and thicker material that feels more premium without the flimsy bend you get from budget cards.
2. SWVL Sports Golf Distance Matrix Bag Tag
The Distance Matrix Bag Tag revolutionizes how you track personal distances with its writable 3-column, 13-row grid design. Unlike pre-printed cards, this lets you record both carry and total distances for all clubs—the data that actually matters for course management. The special writable surface accepts ballpoint pen, though ultra-fine Sharpies yield the best results that won’t smudge after repeated exposure.
Here’s what elevates this above basic distance cards: the bag tag format. Instead of fumbling through your wallet mid-round, it clips directly to your bag’s strap for instant visibility. This seems minor until you’re in the middle of a competitive round and need your 6-iron distance without disrupting your pre-shot routine. The convenience factor alone probably saves 10-15 seconds per club selection, which adds up over 14 club decisions in an 18-hole round.
Golfers report that the act of physically writing their distances creates better retention than digital notes. There’s something about the manual process that cements the numbers in your memory. The writable surface holds up through normal wear, though aggressive scrubbing to change numbers can eventually dull the coating after 5-6 complete rewrites.
✅ Pros:
- Customizable for your actual distances
- Always visible clipped to bag
- Blank format forces you to measure properly
❌ Cons:
- Requires initial time investment to fill out
- Can fade with heavy sun exposure over seasons
Price range: Typically in the $12-$18 range. The durability of the clip mechanism varies—spring-loaded carabiners hold up better than plastic snap clips, so inspect reviews for specific mentions of clip quality before buying.
3. Blue Tees Series 4 Laser Rangefinder
The Blue Tees Series 4 represents the perfect balance between professional-grade accuracy and real-world usability. With a maximum range of 1,000 yards and flagpole-lock capability up to 300 yards, it delivers ±1 yard precision—the same accuracy range as devices costing $300-$400 more. The 6x magnification provides clear visuals even in bright midday sun, and the OLED display switches between red and green modes for optimal readability regardless of lighting conditions.
From a practical standpoint, what sets the Series 4 apart is response speed. You’re getting yardages in under 0.5 seconds consistently, which matters more than most golfers realize. Slow rangefinders tempt you to aim, wait, re-aim, wait again—this rhythm disruption kills confidence and adds mental clutter right when you need clarity. The Series 4 eliminates that frustration with instant feedback.
The slope mode provides “plays-like” distances accounting for elevation changes—absolutely crucial for courses with significant terrain variation. A 150-yard shot uphill might play like 165 yards, and without slope compensation, you’re systematically coming up short. The toggle switch makes it tournament-legal when needed, addressing the one limitation of always-on slope devices. Customer feedback highlights the magnetic cart mount as surprisingly useful—no more setting it down and forgetting it.
✅ Pros:
- Professional-grade accuracy at mid-range price
- Fast response time (under 0.5 seconds)
- Tournament-legal with slope toggle
❌ Cons:
- Requires USB-C charging (no replaceable battery)
- Slightly heavier than basic models at 7.8oz
Price range: Typically around $180-$230 depending on sales. At the $200 mark, it undercuts Bushnell and Garmin premium models by $200-$400 while matching their core performance specs. For the extra $30-$50 over budget rangefinders, you’re buying reliability that lasts 5+ seasons rather than needing replacement after 18 months.
4. Garmin Approach S12 GPS Watch
The Approach S12 takes a different approach—literally wearing your distance data on your wrist. With 42,000+ preloaded courses worldwide and automatic course recognition, you’re getting front/middle/back green distances plus hazard yardages without pulling anything from your pocket. The high-contrast sunlight-readable display remains crystal clear even at noon in Arizona, and the battery lasts up to 30 hours in GPS mode—several full rounds before needing a charge.
What makes the S12 exceptional for distance management isn’t just the yardage data—it’s the shot distance measurement. After each shot, it automatically calculates how far you hit, building your personal distance database. Over 10-15 rounds, you’ll have real data showing your actual 7-iron averages 152 yards, not the 165 you’ve been telling yourself. This reality check alone is worth the investment.
The watch format means zero disruption to your routine. A quick glance at your wrist beats pulling out a rangefinder, aiming, and reading for every single shot. For players who value flow and rhythm, this seamlessness enhances focus rather than fragmenting it. The trade-off? GPS distances are accurate to ±3-5 yards compared to laser’s ±1 yard, but for 90% of golfers, that difference is negligible compared to their strike dispersion.
✅ Pros:
- Automatic shot distance tracking builds personal data
- 30-hour battery life covers multiple rounds
- No mid-swing distractions
❌ Cons:
- Less precise than laser (±3-5 yards vs ±1 yard)
- Requires course updates for newest layouts
Price range: Around $200-$250 typically. For golfers playing multiple courses or traveling frequently, the preloaded course library saves the hassle of downloading maps that standalone GPS units require. The S12 prioritizes battery life over color touchscreens—a smart trade-off since dead technology mid-round helps nobody.
5. WOSPORTS L16 Golf Rangefinder
The WOSPORTS L16 delivers the essentials without the premium price tag. With 1,200-yard maximum range, 6x magnification, and flag-lock vibration confirmation up to 200 yards, it covers everything most amateurs need for course play. The L16 earned praise from Golf Monthly’s reviewers for “reliable target readings comparable to more expensive laser rangefinders” and “clear optical view separating the pin from background clutter.”
Here’s the intelligent buyer’s perspective: most golfers never use 80% of high-end features. The L16 focuses budget on what matters—accurate readings, quick target acquisition, and durable construction. You’re sacrificing the OLED display, magnetic mount, and perhaps 50 yards of maximum range compared to $400 units, but gaining $250 in your pocket. For mid-to-high handicappers still working on consistent ball-striking, that $250 invested in lessons yields far better scoring improvements than marginally faster rangefinder electronics.
The simple three-button interface means less menu-diving and more golf playing. Slope mode toggles via a side switch—no complex button combinations to remember. Users report the CR2 battery lasts an entire season (30-40 rounds) before needing replacement, and the hard case protects it during inevitable bag drops and cart jostling.
✅ Pros:
- Golf Monthly verified accuracy
- Intuitive three-button operation
- Season-long battery life
❌ Cons:
- No magnetic mount (must use case)
- Basic LCD display vs OLED on premium models
Price range: Typically around $75-$100. At this price point, you’re getting legitimate laser accuracy that’s indistinguishable from $300 options for actual on-course use. The $200+ you save buys a lot of range balls, lessons, or a proper fitting—investments that tangibly improve your game more than premium rangefinder features.
How to Build Your Personal Golf Club Distance Chart
Generic charts tell you what the “average” golfer hits. But average golfers shoot 90-100. You want better than average, which starts with personalized data. Building your distance chart requires three steps: measurement, validation, and adjustment.
Step 1: Establish Your Baseline Numbers
Head to the range with a notepad and a plan. Hit 10 balls with each club, discarding the best and worst shot from each set. This gives you 8 representative swings per club—enough to establish a realistic average without letting one perfect flush or one topped shot skew your data. Track both carry distance (where the ball lands) and total distance if possible, though carry matters more for course management.
The common mistake here is hitting range balls with a driver swing mentality—maximum effort, maximum glory. Instead, swing at 80-85% of full power—the realistic speed you’d use with mid-irons on the course when accuracy matters. Your ego wants to record that one 7-iron that flew 175 yards. Your scorecard needs to know you average 158 yards with solid contact.
For best results, use a rangefinder or GPS app to measure actual distances rather than relying on range markers. Many driving ranges have worn-down or misplaced yardage signs, and that 150-yard marker might actually sit at 135 yards. This 15-yard error compounds across all your clubs if you’re using it as your measurement reference. Some golfers use launch monitors—even budget options like the PRGR around $200 provide carry distance data that’s within 2-3 yards of professional-grade systems.
Step 2: Validation Through On-Course Play
Range data is a starting point, but course data is truth. Over your next 5-10 rounds, note which club you hit to each green and compare the outcome to your chart. If your chart says your 7-iron goes 155 yards but you consistently come up 10 yards short, you’re either not accounting for carry-only distance or your range measurements were inflated.
Pay particular attention to elevated greens and prevailing winds—these are the conditions where amateur distance estimation breaks down completely. A 10-mph headwind can subtract 10-15 yards from iron shots, while a two-club elevation change adds another 10-15 yards of “play-like” distance. Your chart should have an asterisk reminding you: these are neutral-condition distances, adjust for wind and elevation.
The validation phase also exposes gapping problems. You might discover your 6-iron and 7-iron both go roughly the same distance despite different loft numbers. This happens with modern strong-lofted irons where manufacturers have de-lofted everything to make marketing claims about distance. When you find gaps smaller than 8-10 yards or larger than 15 yards, that’s your signal to consider club adjustments or filling the gap with a hybrid or wedge.
Step 3: Seasonal Adjustments and Updates
Your distances aren’t static—they change with fitness, swing modifications, equipment adjustments, and even seasonal temperature variations. In 40°F winter weather, expect to lose 5-8 yards per club compared to 85°F summer rounds. The ball simply doesn’t compress as efficiently in cold air, and most golfers swing more cautiously when bundled in layers.
Every 3-4 months, validate your numbers with a fresh range session. If you’ve been working with a coach on swing changes, your distances might increase 5-15 yards as you improve your strike quality and sequencing. These aren’t trivial differences—a 10-yard gain across your irons means you’re hitting one less club into greens, which statistically correlates with lower scores since shorter clubs are easier to hit straight.
Real-World Application: Matching Distances to Your Game
Understanding average distances means little without context. Here’s how three different player profiles should approach their distance charts and club selection differently.
The Weekend Warrior (18-25 Handicap): You’re swinging driver around 85-90 mph, carrying it 200-220 yards total. Your 7-iron probably goes 135-145 yards. Your biggest distance leak isn’t speed—it’s inconsistent strike patterns. One 7-iron might fly 145 yards with center contact, while the next goes 125 yards from a thin strike or heavy contact.
Your chart strategy focuses on worst-case distance management. If your 7-iron ranges from 125-145 yards depending on strike, you need to know that 135 yards is your average, but more importantly, 125 yards is your “danger zone” distance. When facing a 140-yard shot with water short of the green, club up to 6-iron. Accept that a well-struck 6-iron might go 155 yards and land on the back edge—that’s dramatically better than coming up short.
The Consistent Mid-Handicapper (10-15 Handicap): Your 90-95 mph driver speed carries the ball 230-245 yards, and your 7-iron consistently goes 150-160 yards. You’ve developed reliable contact but lack the ability to work the ball or control trajectory. Your distance chart is reasonably accurate, with variance of only 5-7 yards per club.
Your strategy involves micro-adjustments. When faced with 157 yards, you know your stock 7-iron goes 155 yards. Instead of mindlessly grabbing 6-iron, consider a hard 7-iron with confidence. This shot selection requires honest assessment of your current ball-striking—if you’re in a groove, trust the 7-iron. If you’ve been fighting a hook all day, take the 6-iron and accept the back-of-green result.
The Low Handicapper (5-9 Handicap): At 100-105 mph driver speed, you’re carrying 255-270 yards, and your 7-iron sits in the 165-175 range. You strike the ball consistently within 5 yards of your average, and you can manipulate trajectory with different ball positions and swing speeds.
Your distance chart becomes granular. You know your 7-iron goes 170 yards with a stock swing, 165 yards with a controlled knockdown, and 175 yards with a full release. These aren’t different clubs—these are different swing variations from the same club. Your chart should reflect these options, noting that downwind you can squeeze an extra 5 yards by releasing fully, while into wind you can take 5 yards off with a lower trajectory punch shot.
Common Golf Club Distance Chart Mistakes to Avoid
Mistake #1: Recording “Hero Distances”
I see this constantly—golfers record their absolute best shot with each club rather than their realistic average. Your 7-iron went 170 yards that one time with a perfect strike, downwind, on a firm fairway? Great. But if your typical 7-iron goes 155 yards, that’s the number that belongs on your chart. Recording hero distances means you’ll be systematically short on approach shots, missing greens, and wondering why you can’t score despite “knowing your distances.”
The psychology here is understandable—you want to believe you hit it far. But golf rewards accuracy over ego. If you record inflated distances, you’re essentially lying to yourself and suffering the consequences every round. The solution is systematic: hit 10 balls, throw out the best and worst two, and average the remaining six. That’s your number. Not the longest. Not what you “should” hit. What you actually hit.
Mistake #2: Ignoring Environmental Adjustments
Your distance chart shows 150 yards to the pin, you pull your 150-yard club, and you come up 15 yards short. What happened? You ignored the 15-mph headwind that effectively adds a club or more of distance. Or you played your sea-level distances at a 6,000-foot elevation course where the ball flies 10% farther in thin air.
Environmental adjustments aren’t optional—they’re required for accurate club selection. Temperature affects distance by roughly 2 yards per 10-degree change. Humidity has minimal impact despite popular belief—dry air at 20% humidity vs humid air at 80% humidity changes distance by less than a yard. Altitude adds approximately 5% distance per 2,000 feet of elevation. Wind is the biggest variable: add/subtract 1% of distance per 1mph of wind (a 10mph wind changes a 150-yard shot by 15 yards). Understanding the physics of golf ball flight helps explain why these environmental factors matter so much.
Mistake #3: Using Generic Charts Instead of Personal Data
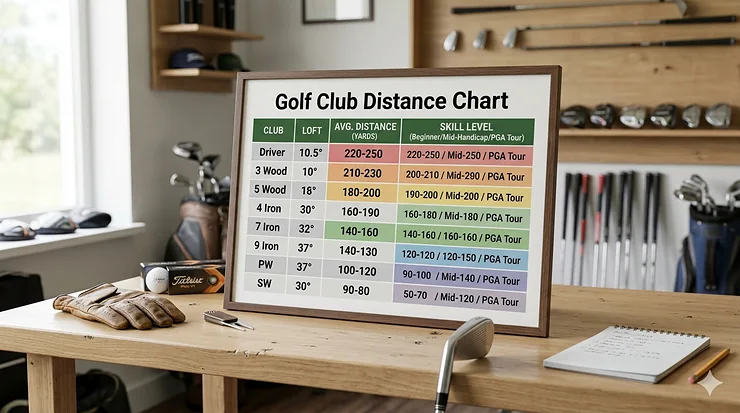
Those pre-printed distance cards? They’re starting points, not answers. The “average golfer” 7-iron distance of 150 yards assumes a specific swing speed, loft angle, ball type, and strike quality. Your 7-iron might have 28° of loft (modern strong loft) while the chart assumes 34° (traditional loft)—that’s a 10-15 yard difference right there.
Modern game-improvement ions have gotten progressively stronger lofted to create marketing-friendly “distance” claims. What manufacturers call a 7-iron today would have been a 6-iron or even 5-iron 20 years ago. This means generic charts built on traditional lofts will be wildly inaccurate for your modern clubs. The only solution is measuring your actual clubs with your actual swing.
Mistake #4: Neglecting Gapping Analysis
You diligently fill out your distance chart: Driver 240 yards, 3-wood 215 yards, 5-iron 180 yards, 6-iron 170 yards, 7-iron 160 yards… wait. Your 5-iron and 6-iron are separated by only 10 yards, but your 3-wood and 5-iron have a 35-yard gap? You’ve discovered gapping problems—the hidden distance leaks that cost you strokes.
Ideal gapping is 10-15 yards between adjacent clubs. Less than 8 yards means you effectively have duplicate clubs taking up bag space. More than 15 yards means you have distance ranges where you have no good option—forced to swing hard with one club or soft with another, both low-percentage plays. The solution might be adding a hybrid to fill that 3-wood to 5-iron gap, or adjusting lofts with a club-fitter to optimize your specific set.
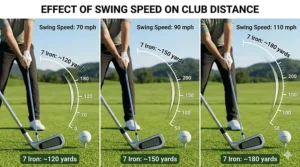
Golf Club Distance Chart by Swing Speed
| Driver Swing Speed | Driver Distance | 7-Iron Distance | PW Distance | Typical Handicap |
|---|---|---|---|---|
| 75 mph | 180-195 yards | 115-125 yards | 75-85 yards | 25-30 |
| 85 mph | 205-220 yards | 135-145 yards | 90-100 yards | 18-24 |
| 95 mph | 230-250 yards | 155-165 yards | 105-115 yards | 10-17 |
| 105 mph | 255-275 yards | 170-180 yards | 120-130 yards | 5-9 |
| 115 mph | 280-300 yards | 185-195 yards | 135-145 yards | Scratch-Plus |
This table reveals the tight correlation between swing speed and distance across all clubs. What’s interesting here is the proportional relationship—if you increase driver speed by 10 mph, you gain roughly 25 yards with driver but only 10 yards with 7-iron and 5 yards with pitching wedge. The longer the club, the more swing speed matters. This explains why most distance-training programs focus obsessively on driver speed—the gains there cascade through your entire bag, and the percentage improvement is most dramatic on the club you hit 14 times per round.
The handicap correlation is approximate but revealing. A 105 mph driver speed typically pairs with 5-9 handicap not because swing speed directly determines scoring, but because the athleticism and practice volume required to generate 105 mph typically produces better ball-striking and short game skills simultaneously. That said, I’ve coached 20-handicappers with 100+ mph speed who can’t break 90—speed is necessary but insufficient for low scores.
Understanding Loft Distance Correlation and Club Gapping
The loft angle on your club is the single biggest determinant of how far the ball flies—more important than swing speed, shaft selection, or clubhead design. Every 4 degrees of added loft reduces distance by approximately 10-12 yards (all else being equal). This is why your 7-iron goes 150 yards and your 8-iron goes 140 yards despite similar swing speeds—that 4-5 degree loft difference is doing the heavy lifting. Research from Trackman, the industry-standard launch monitor used by PGA Tour professionals, confirms this loft-distance relationship across millions of recorded golf shots.
Modern club manufacturers have figured this out, leading to the “strong loft revolution” of the past 15 years. What used to be a 34-degree 7-iron is now marketed as a 28-degree 7-iron, instantly adding 10-15 yards of distance. Is this genuine distance improvement? No—it’s a relabeling trick. You’re hitting a club with 6-iron loft that happens to have a “7” stamped on it.
This matters enormously for gapping. Traditional iron sets had 3-4 degrees between each club: 7-iron at 34°, 8-iron at 38°, 9-iron at 42°, PW at 46°. This produced consistent 10-12 yard gaps. Modern strong-lofted sets compress the long and mid-iron lofts (7-iron at 28°, 8-iron at 32°, 9-iron at 37°) but run out of room in the scoring clubs. Suddenly your pitching wedge is 43° instead of 46°, and your gap wedge needs to be 48° to maintain proper spacing. You’ve effectively deleted the traditional 2-iron and 3-iron to create space for these extra wedges.
The practical impact: if you play modern strong-lofted irons, your distance chart will show longer iron distances than traditional charts—but you’ll also need 3-4 wedges instead of 2-3 to cover the short game. Neither system is “better,” but understanding which system your clubs follow prevents you from misinterpreting distance charts or comparing your 7-iron distance to someone playing traditional lofts.
Golf Club Distance Chart Comparison: Pro vs Amateur
| Club | PGA Tour Average | Scratch Golfer | 10 Handicap | 20 Handicap |
|---|---|---|---|---|
| Driver | 295-310 yards | 270-285 yards | 235-255 yards | 205-225 yards |
| 3-Wood | 250-270 yards | 230-250 yards | 205-220 yards | 180-195 yards |
| 5-Iron | 195-210 yards | 180-195 yards | 165-180 yards | 145-160 yards |
| 7-Iron | 170-185 yards | 160-175 yards | 150-165 yards | 130-145 yards |
| PW | 140-150 yards | 130-145 yards | 115-130 yards | 95-110 yards |
The data here tells a fascinating story beyond raw distance. Notice the gap between PGA Tour and scratch golfer is only 10-15 yards per club, but the gap between scratch and 10-handicap is 15-20 yards, and 10-handicap to 20-handicap is 20-25 yards. Distance variation increases as skill decreases, which makes intuitive sense—pros hit the center of the face consistently, while 20-handicappers spray contact all over the clubface. PGA Tour ShotLink statistics provide the most comprehensive database of professional golf performance data available.
More interesting is what this reveals about the path to improvement. A 20-handicapper working toward 10-handicap needs to gain roughly 20 yards per club. Some of that comes from swing speed gains through fitness or better sequencing. But most of it comes from strike quality—simply hitting the ball in the middle of the face more often. A perfectly struck 7-iron by a 20-handicapper goes as far as their average 6-iron. They’re not lacking distance potential; they’re lacking consistency.
For the scratch golfer chasing PGA Tour distances, the math gets harder. That 10-15 yard per club deficit is almost entirely swing speed—tour pros average 115+ mph driver speed vs 105 mph for scratch amateurs. You can’t “practice your way” to higher swing speed beyond a certain point; you need dedicated speed training or genetic advantages. This is why scratch golfers should focus on scoring skills—improving from scratch to plus-handicap requires better short game and course management, not longer drives.
Frequently Asked Questions
❓ How do I measure my actual golf club distances accurately?
❓ Why are my golf club distances shorter than the average charts?
❓ Should I use carry distance or total distance for my chart?
❓ How often should I update my golf club distance chart?
❓ What's the ideal distance gap between golf clubs?
Conclusion: Your Distance Chart is Your Scoring Blueprint
Mastering your golf club distance chart transforms guesswork into precision, and precision lowers scores faster than any swing tip or equipment upgrade ever will. The golfers who consistently shoot their lowest rounds aren’t necessarily the longest hitters—they’re the players who know exactly which club puts them pin-high from every yardage on the course.
Your action plan starts today: invest in measurement tools (even a $10 distance card beats guessing), dedicate three range sessions to building your baseline numbers, and validate those numbers over your next five rounds. Track not just distance but strike quality, environmental conditions, and gapping between clubs. Within a month, you’ll have personalized data that’s more valuable than any generic chart could ever provide.
The distance tracking tools I’ve covered—from budget reference cards to GPS watches to professional-grade rangefinders—are force multipliers for this process. They don’t hit shots for you, but they eliminate one of the game’s most common scoring leaks: selecting the wrong club. When you consistently put the ball on the green from 150 yards instead of 10 yards short, you’re suddenly making more birdies and avoiding those momentum-killing bogeys from short-sided positions.
Remember that your distance chart is a living document. As you improve your swing, gain clubhead speed, or adjust equipment, your numbers will change. Embrace that evolution—it means you’re getting better. The chart you build today is just the starting point for the chart you’ll have next season, and the season after that. Each iteration brings you closer to understanding your true capabilities and unlocking lower scores.
Recommended for You
- 7 Best Golf Ball Compression Guide Rankings for 2026
- Golf Shaft Flex Guide: 7 Best Shafts to Upgrade Your Game in 2026
- 7 Best Ways How to Choose Golf Clubs in 2026
Disclaimer: This article contains affiliate links. As an Amazon Associate, I earn from qualifying purchases. If you purchase products through these links, we may earn a small commission at no additional cost to you.
✨ Found this helpful? Share it with your friends! 💬🤗